ELB solutions often provide scalable cloud computing capacity.
ELB offers enhanced features including:
- Detection of unhealthy instances.
- Spreading instances across healthy channels only.
- Flexible cipher support.
- Centralized management of SSL certificates.
- Optional public key authentication.
- Support for both IPv4 and IPv6.
(Image Source:- Google)
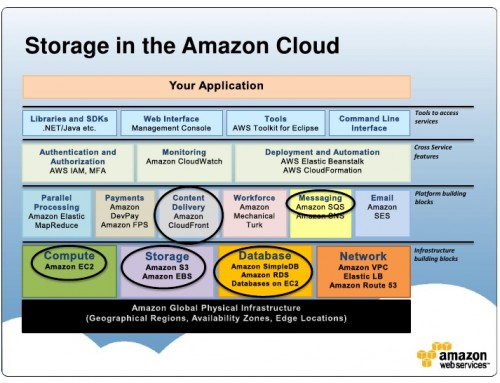
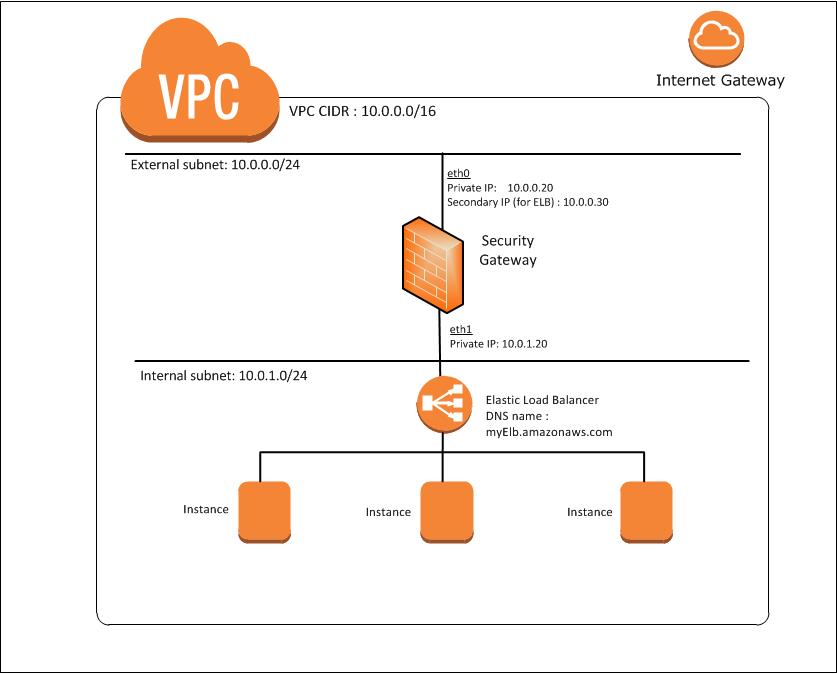
Elastic Load Balancing (ELB) is an AWS service used to dispatch incoming web traffic from your applications across the Amazon EC2 backend instances, which may be in different availability zones. ELB is widely used by web and mobile applications to help ensure a smooth user experience and provide increased fault tolerance, handling traffic peaks and failed EC2 instances without interruption.
ELB optimizes the incoming application traffic. Users can enable ELB within a single availability zone or across multiple availability zones to maintain consistent application performance.
The most well-known ELB solution is Amazon’s EC2 (Elastic Compute Cloud). However, other vendors have also offered ELB in recent years. ScaleBase offers an ELB solution with real-time elasticity, which simplifies the ability to scale the MySQL RDBMS (relational database management system) without requiring infrastructure changes or taking services offline.
With Auto Scaling, AWS can ensure your infrastructure includes the right number of EC2 hosts to support your changing application load patterns.
ELB needs to be continuously monitored and its key metrics well understood to ensure that the load balancer itself and the EC2 instances behind it remain healthy. There are two broad categories of ELB metrics to monitor:
- Load balancer metrics
- Backend-related metrics
Load balancer metrics

(Image Source:- Google)
The first category of metrics to consider from the load balancer itself, as opposed to the backend instances registered with the load balancer.
Elastic Load Balancing configuration requires one or more listeners, which are ELB processes that check for connection requests. The HTTPCode_ELB_* metrics named above will be available only if the listener is configured with HTTP or HTTPS protocol for both front- and back-end connections.
Metrics to alert on:
- RequestCount:
- SurgeQueueLength
- SpilloverCount
- HTTPCode_ELB_5XX
Backend-related metrics

(Image Source:- Google)
CloudWatch also provides metrics about the status and performance of your backend instances, for example response latency or the results of ELB health checks. Health checks are the mechanism ELB uses to identify unhealthy instances so it can send requests elsewhere. Use the default health checks or configure them to use different protocols, ports, or healthy/unhealthy thresholds. The frequency of health checks is 30 seconds by default but you can set this interval to anywhere between 5–300 seconds.
These counts can be tricky to interpret in CloudWatch in some cases. Indeed, when is enabled on an ELB (to make sure traffic is evenly spread across the different availability zones), all the instances attached to this load balancer are considered part of all AZs by CloudWatch. So if you have for example two healthy instances in one zone and three in the other, ELB will display five healthy hosts per AZ, which can be counter-intuitive.
Metrics to alert on:
- HealthyHostCount and UnHealthyHostCount
- Latency
Metrics to watch
- BackendConnectionErrors
- About timeouts